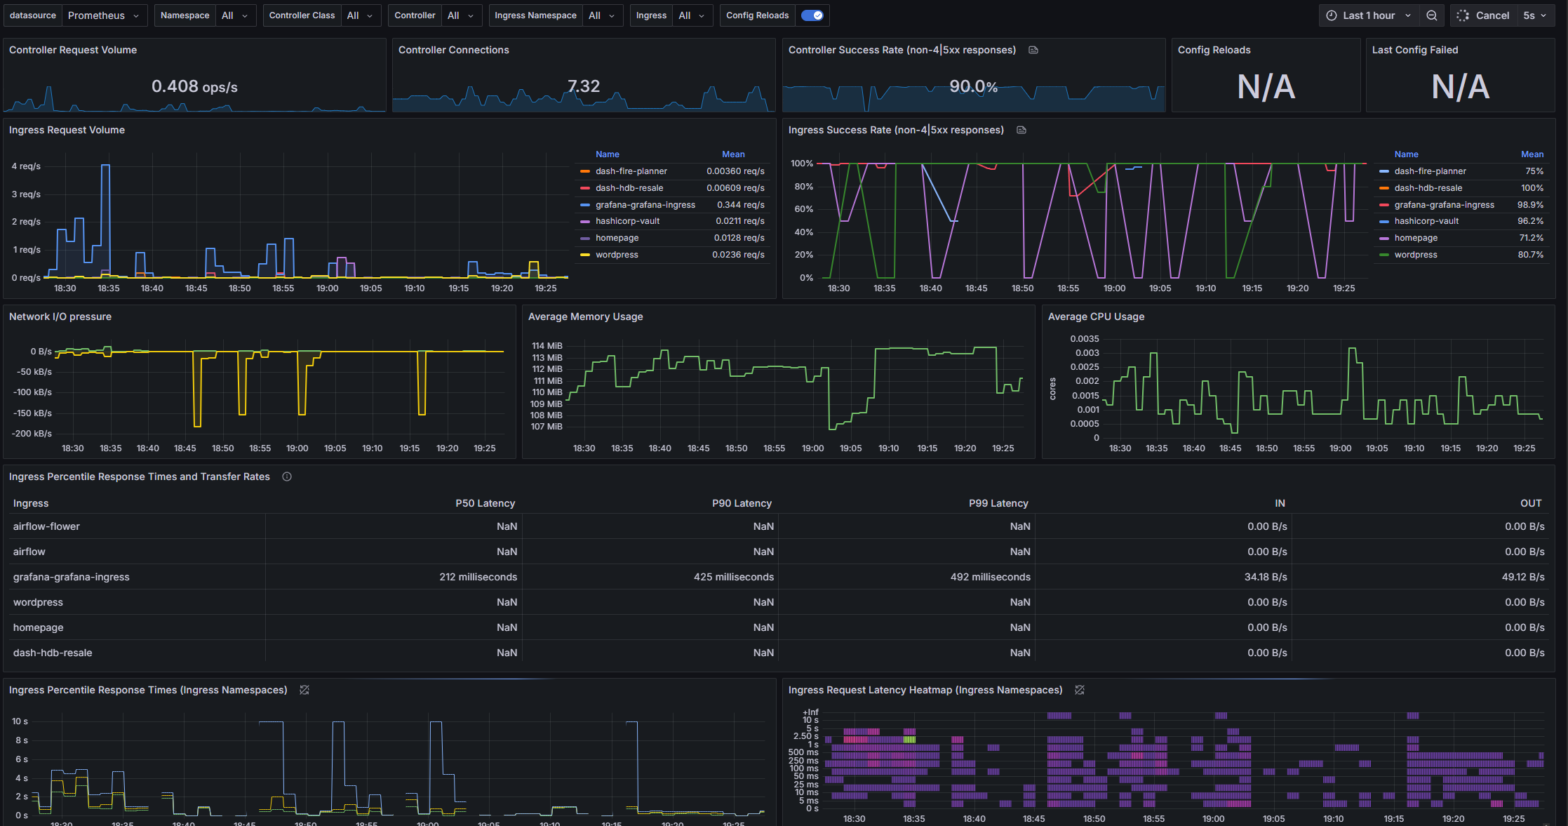
With the Prometheus-Loki-Grafana stack being deployed, the observability stack has been fully deployed on the Kubernetes cluster. Operational metrics gathered by Prometheus and logs aggregated by Loki are finally fed into the Grafana for easier visualisation.
I have spoken about Prometheus (https://prometheus.io/) in my last post so I will not repeat it.
In terms of Loki (https://grafana.com/oss/loki/), it is easier to set up than I originally thought, given the number of components that make up Loki (12 components in total). Roughly about half of these components are core components that are needed for Loki to function (e.g. distributor, ingester), but the other half are optional supporting components that can be turned off safely (e.g. query scheduler, table manager).
Most of the heavy lifting is done by Promtail, as it automatically discovers target logs to be scraped and pushes them to Loki. In contrast, a separate exporter needs to be setup per pod/service to make metrics visible to Prometheus, which involves a lot more efforts. That being said, Promtail has now been deprecated (https://grafana.com/docs/loki/latest/send-data/promtail/).
As for Grafana (https://grafana.com/), it seems like a simple dashboard solution that is built mostly for observability purposes. But it impresses me in a few ways.
Grafana is very efficient in terms of resource usage relative to its speeds of performance. The entire Grafana could run on less than 200Mb memory, while doing live refresh of data-heavy dashboard. Other dashboard solutions that I have worked with will not be able to cope with the same amount of data with same refresh speed without significant configuration effort (setup caching etc.).
As I am working with Grafana operator (https://github.com/grafana/grafana-operator), it is very easy to configure data sources and dashboards in Grafana. I just have to define GrafanaDashboard and GrafanaDataSource CRDs, and Grafana will be able to pick them up automatically.
The definition of Grafana dashboards in json format is interesting as well. It is easy to version control and could be modified in its raw text format. The only complain I have is that the public gallery of Grafana dashboards (https://grafana.com/grafana/dashboards/) is relatively limited in terms of selections. Based on my anecdotal experience, most dashboard submissions on there are outdated so not deployable out of the box.
Besides observability for metrics and logs, another common observability implementation is to monitor internal network traffic using a service mesh like LinkerD (https://linkerd.io/). I will leave this for another day, purely due to a lack of time.
The last piece of core supporting Kubernetes service that I will set up next will be the Kubernetes resources and volumes backup using Velero (https://velero.io/). While most of my Kubernetes deployments are stateless, I do run a few databases as well. Losing the data on them will be a disaster if there is no backup.

